Analytics
Your geo-targeting performance dashboard
Your Geo-Targeting Dashboard
See exactly how your geo-targeting rules are performing. Every click, every view, every redirect — tracked and visualized in one place.
Understand where your visitors are, what device they use, and how they found you. No setup required — analytics start recording the moment you create your first rule.
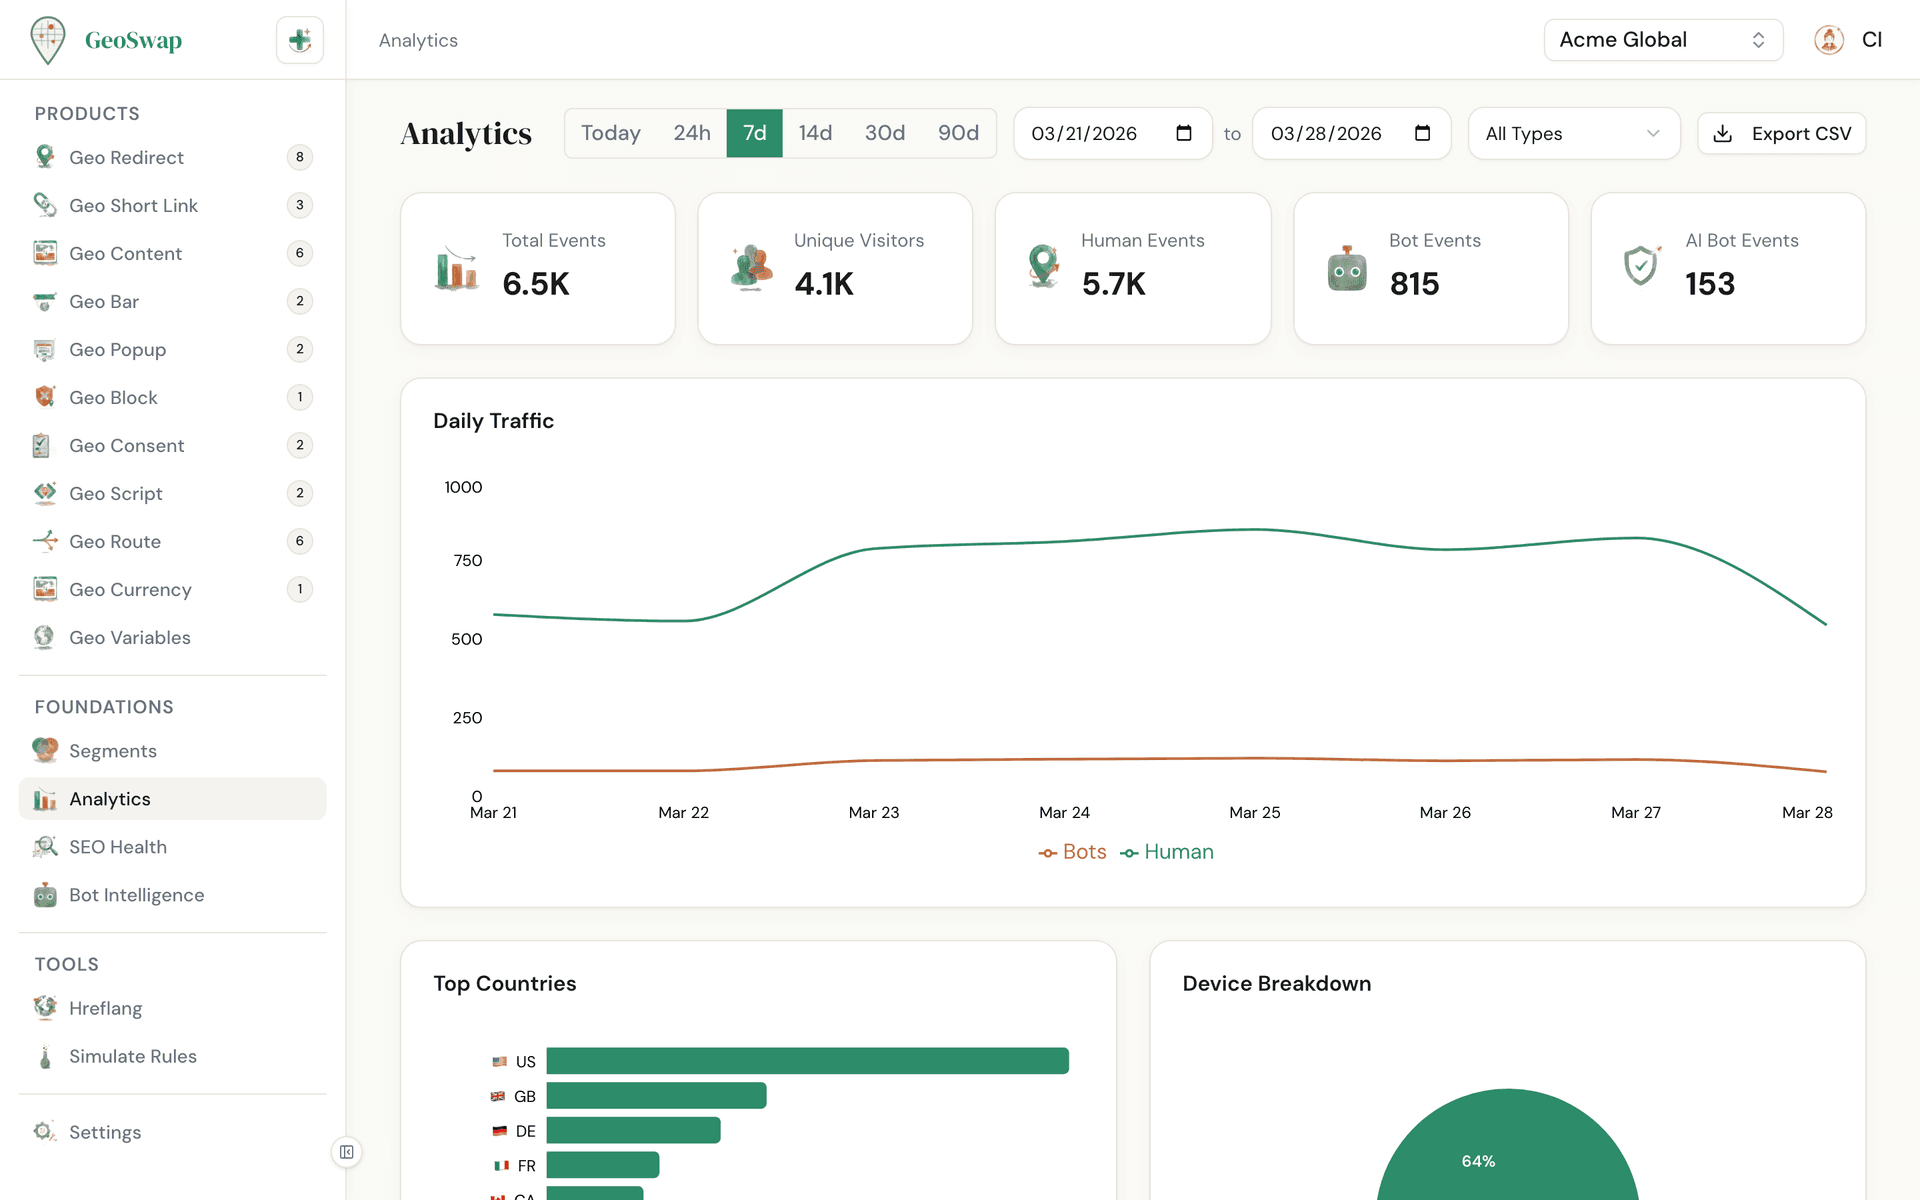
What's Tracked
Every time a geo rule fires — a redirect, a content swap, a bar display, a popup shown — GeoSwap logs the event with full context.
Country breakdown
See which countries are generating the most traffic. Drill into any country to see rule-level performance.
Device breakdown
Desktop vs mobile vs tablet. Know how your audience is browsing so you can optimize accordingly.
Browser & OS
Chrome, Safari, Firefox, Edge, and more. Paired with operating system data so you spot compatibility trends.
Referrers
Where your traffic is coming from. See which sites, search engines, and social platforms are driving visitors.
UTM parameters
Track marketing campaigns with full UTM support. See exactly which campaigns are driving geo-targeted traffic.
Unique visitors
Privacy-safe visitor counting using SHA-256 hashing. No cookies, no personal data stored.
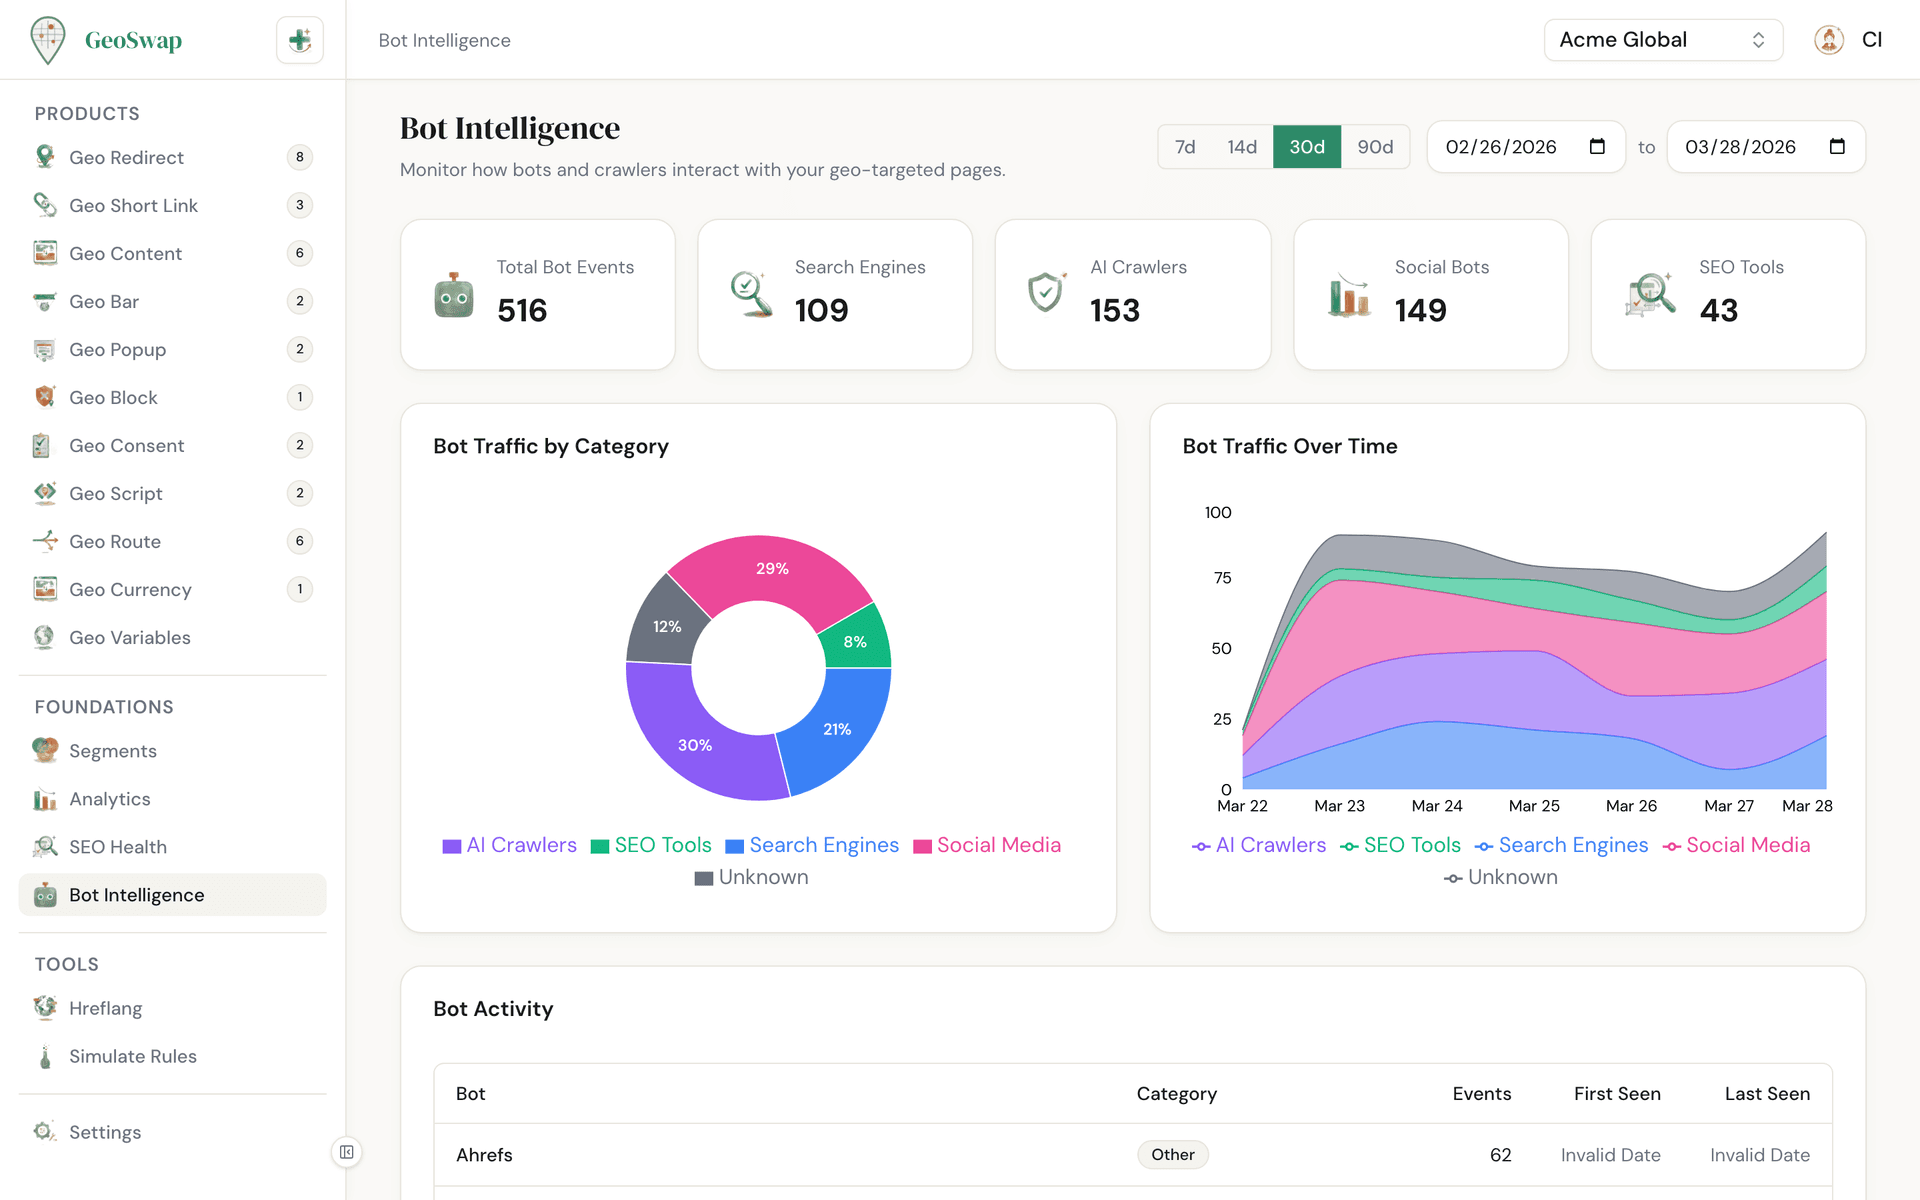
Bot Intelligence
Bot traffic is separated from human traffic automatically. Your analytics stay clean, and you get a dedicated view into what bots are doing on your site.
GeoSwap detects 65+ bots automatically — search engines, AI crawlers, monitoring tools, and more.
Bot traffic gets its own dashboard, so your human analytics are never polluted.
AI bots are flagged separately: see if ChatGPT, Claude, or Perplexity are crawling your site.
Why this matters: know if AI is indexing your content correctly, and track how AI traffic grows over time.
Filtering & Exploration
Slice and dice your data to find exactly what you need. Every dimension is filterable, and you can combine filters for precise insights.
Date range
View analytics for any time period within your plan's history window.
Product type
Filter by redirects, links, content rules, bars, popups, or any other product.
Specific rule
Drill into a single rule to see its performance in isolation.
Top countries, browsers & referrers
Ranked lists show you what's driving the most traffic at a glance.
CSV Export
Need your data in a spreadsheet? Download your analytics as a CSV file with one click. Available to admin and owner roles.
Export includes all dimensions — country, device, browser, OS, referrer, and UTM parameters. Perfect for reporting, deeper analysis, or sharing with stakeholders.
Free vs Pro Analytics
Both plans include full analytics with every dimension and bot detection. The difference? How far back you can look.
Feature
Free
Pro
History
7 days
90 days
All dimensions
✓
✓
Bot detection
✓
✓
CSV export
✓
✓
UTM tracking
✓
✓
Unique visitors
✓
✓
Need more history?
Upgrade to Pro for 90 days of analytics history. See pricing →
Next up
Learn how to manage your team and control who has access.